Guide
What is a heatmap?
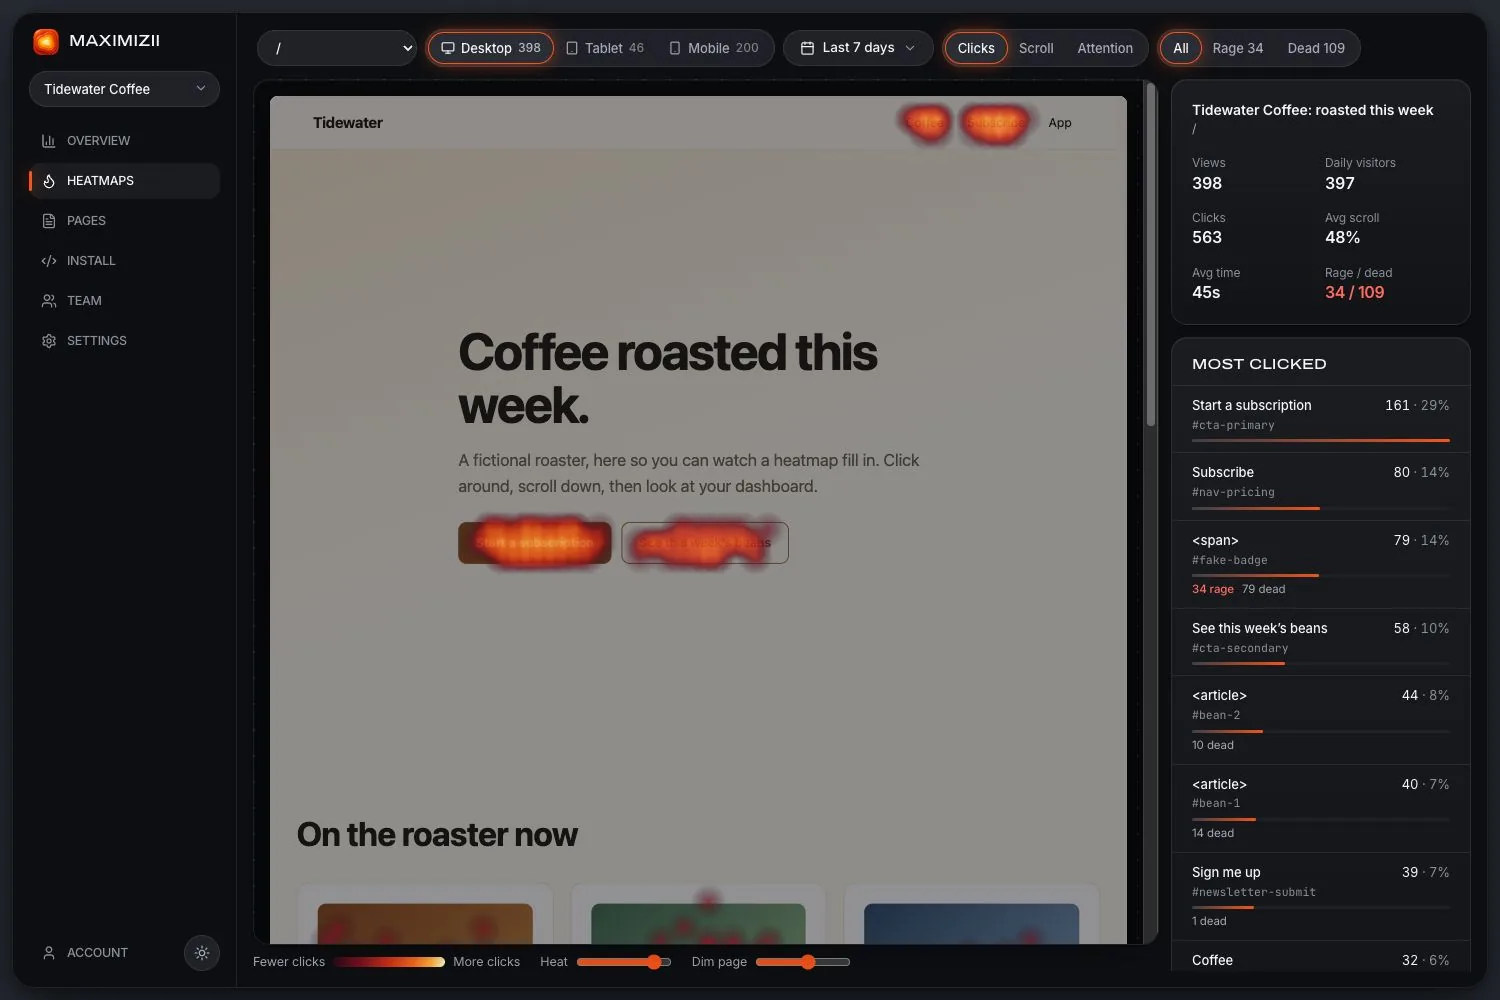
A heatmap shows numbers as colour: hot where there’s a lot, cool where there’s little. On a website, it’s a picture of your page, coloured by what everyone did on it.
In short
A heatmap is a picture that uses colour to show where values are high or low. A website heatmap adds up what many visitors did on a page, usually clicks or scrolling, and draws it over that page, so you can see patterns at a glance without reading a table.
The main kinds of website heatmap
Maximizii draws the first three. We left out movement maps because the signal is noisy for the amount of data they take, and they don’t exist on phones.
How one gets made
A small script runs on the page
It notes each click’s position and element, how far the page was scrolled, and how long each part was on screen.
A picture of the page is taken
Usually once per page and device, so there’s something to draw on.
Everything gets added up
The numbers from all visits in your date range are combined by page and device.
Colour goes on top
Busier areas are drawn hotter. Colours are relative: the hottest spot is just the busiest on this page, not good or bad in itself.
What a heatmap can’t tell you
- Why. You see that people clicked a picture, not what they hoped would happen.
- One person’s path. A heatmap adds everyone together. To follow one visit, you need session replay.
- Whether it worked. More clicks on a button isn’t more sales. Check that in your analytics.
- Much, from a small sample. A few dozen visits can draw a confident-looking pattern that means nothing.
Heatmaps outside websites
The word covers plenty of other things: tables in a spreadsheet coloured by value, maps coloured by region, and activity charts for runners. They share the idea of colour for quantity. Everything on this site is about the website kind.
Questions
What is a heatmap used for?
On a website, it’s for finding out how people actually use a page: whether they see and click the important things, what they ignore, and where they run into trouble.
What do the colours mean?
Hot colours mark the busiest areas of that map, and cool or dark ones the quietest. They’re relative to the page, so check the actual numbers before drawing conclusions.
Is a heatmap the same as session replay?
No. A heatmap adds up all visits into one picture. Session replay shows one visit at a time, as a recording.
Do heatmaps work on phones?
Yes, but phones need their own map, since the layout and the fold differ. Good tools also separate real taps from touches that are only scrolling.
Keep reading
- How to read a heatmapCheck the sample, read each map in turn, and turn what you see into a change.
- Heatmap examplesFive real heatmaps from a sample shop, and what each one is saying.
- Website heatmapsClick, scroll and attention maps over a picture of your real page, from one line of code.
- Heatmaps vs session replayWhat each is for, what each costs, and why we built only one of them.
- Click mapsSee what people click, ranked by element, with labels and selectors.
- Scroll mapsHow far down people get, how many reach each depth, and where the fold falls.
Find out where they click.