Guide
How to read a heatmap, and do something about it.
A heatmap is easy to look at and easy to misread. This is a short routine for going from a picture to a change you can make.
In short
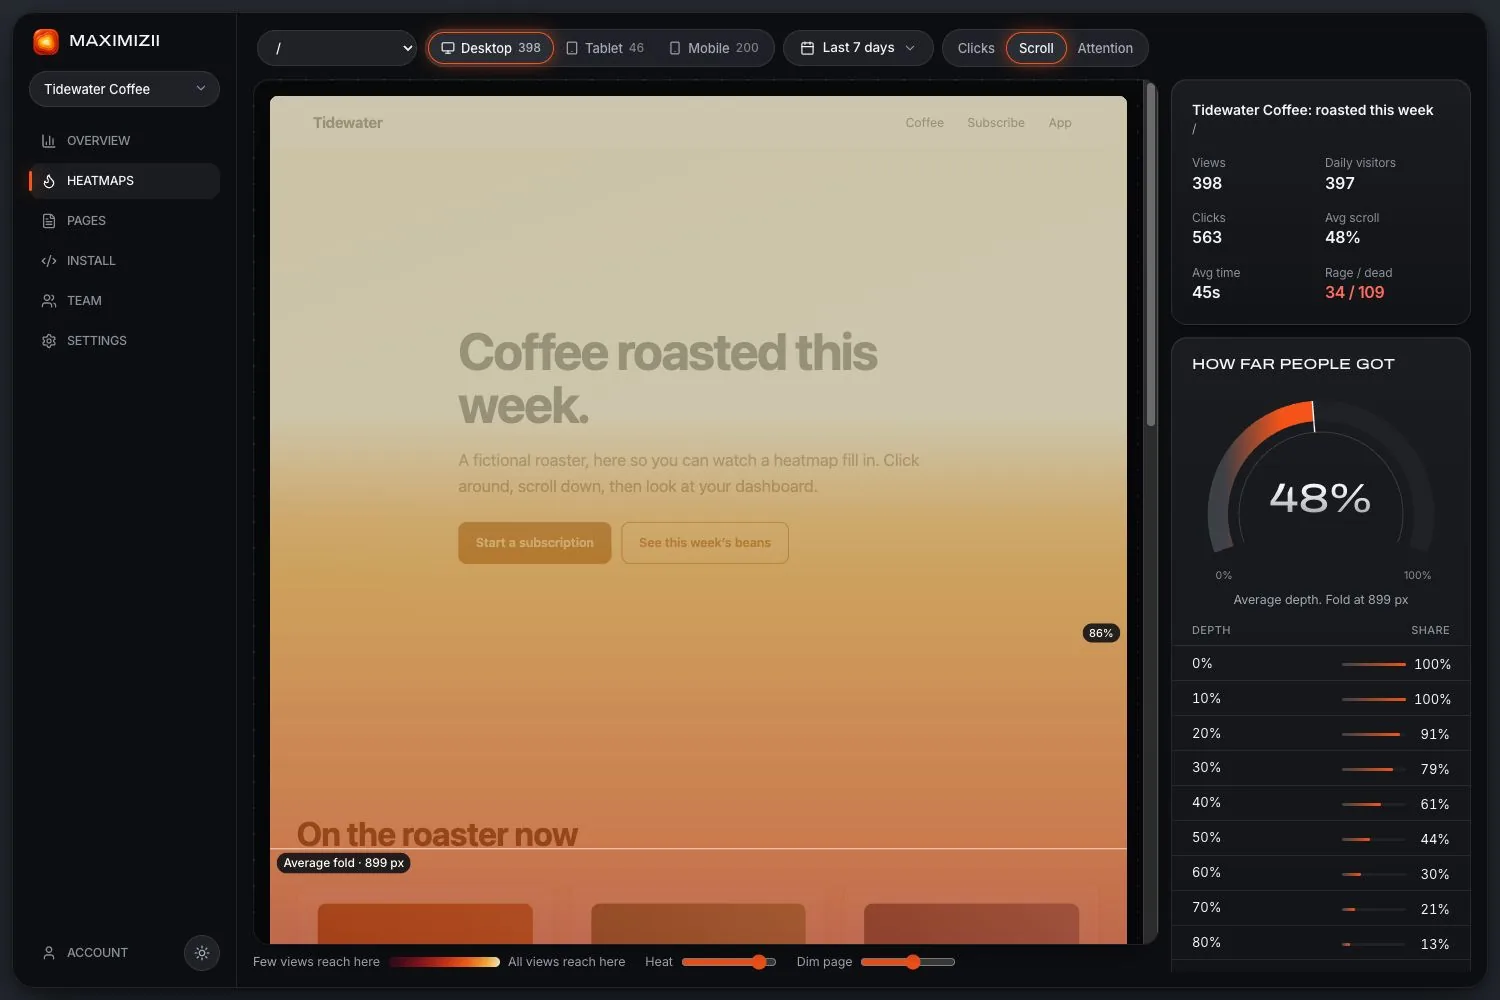
To read a heatmap, first check it’s based on enough visits, on one device, in a sensible date range. Then look at clicks for what people try to do, scroll for what they reach, and attention for what they stop at. Turn each finding into one change, then compare again.
Before you look at the colours
Check the sample
As a rough guide, wait for a few hundred views on the device you’re looking at. With fewer, a handful of clicks can look like a pattern.
Pick one device
Phones and desktops have different layouts, so a mixed picture hides more than it shows. Most sites should start with phones.
Check the date range
Start with the period since your page last changed. Include whole weeks, because weekends often behave differently.
Check the picture is current
If your page has changed a lot, refresh its snapshot, so the heat sits on what people saw.
Then read each map in turn
Common mistakes
- Reading colour as quality. Red only means busy. A hot “Help” link may be bad news.
- Comparing colours across pages. Colours are relative to each map. Compare the percentages instead.
- Acting on a few clicks. Check the count on the element, not just its colour.
- Forgetting sticky elements. Sticky menus get clicks at every depth, which can make them look more popular than they are.
- Stopping at the map. A map tells you where to look. Confirm with your analytics, or by asking someone to try the page.
Turning it into a change
Write down one finding and one change: “Half our phone visitors never reach the sign-up button, so we’ll move it above the testimonials.” Make the change, wait for about the same amount of traffic, and compare. Only the latest picture of a page is kept, so note the date and the numbers you’re comparing against.
Questions
How do you analyze a heatmap?
Start by checking you have enough visits on one device. Then ask what people try to do (clicks), what they reach (scroll) and what they stop at (attention). Then turn it into one specific change to test.
What do red areas on a heatmap mean?
They’re the busiest areas of that map. That isn’t good or bad in itself: it depends on whether it’s where you want people clicking.
How much traffic do you need?
There’s no fixed number, but as a rough guide a few hundred views per device. High-traffic pages get there in days, and small sites may need weeks.
How often should I check heatmaps?
After each significant change to a page, and on your most important pages every month or so.
Keep reading
- Heatmap examplesFive real heatmaps from a sample shop, and what each one is saying.
- What is a heatmap?What a website heatmap shows, the main kinds, and what it can’t tell you.
- Scroll mapsHow far down people get, how many reach each depth, and where the fold falls.
- Click mapsSee what people click, ranked by element, with labels and selectors.
- Landing page heatmapsIs your main button seen and clicked? Check before you spend more on traffic.
- Above the foldWhat it means, why there’s no single fold, and how to find yours.
Find out where they click.