Guide
Five heatmap examples, and what each is telling you.
All five come from one sample site: a made-up coffee roaster, in our real dashboard, with generated traffic. The numbers are illustrations, but the patterns are the ones to look for.
In short
These examples show a click map, rage clicks, dead clicks, a scroll map and an attention map of the same home page. Between them they show a healthy main button, a badge people mistake for a link, and a page where most of the attention stays near the top.
1. A click map with a clear winner
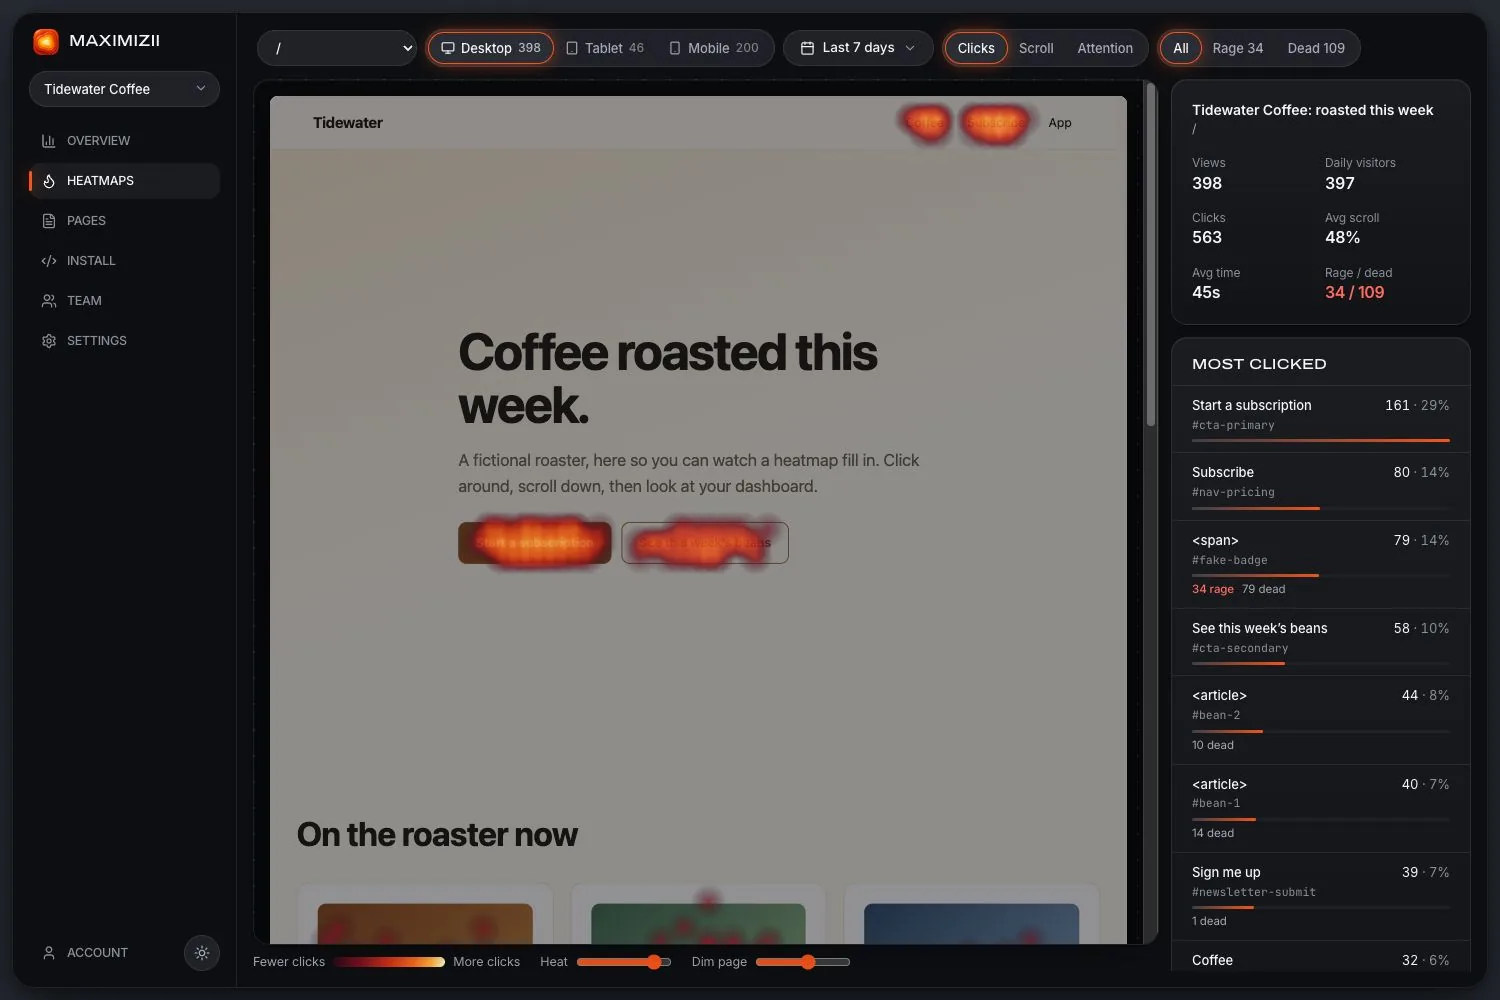
On desktop, this page had 398 views and 563 clicks. The main button, “Start a subscription”, takes 161 of them, or 29%. The menu link “Subscribe” takes another 80. People are finding the main action, in two places.
What to do: not much, on this evidence. A clear leader that matches what you want is the result you’re hoping for. If the winner were something else, that’s where you’d start.
2. Rage clicks on something that isn’t a button
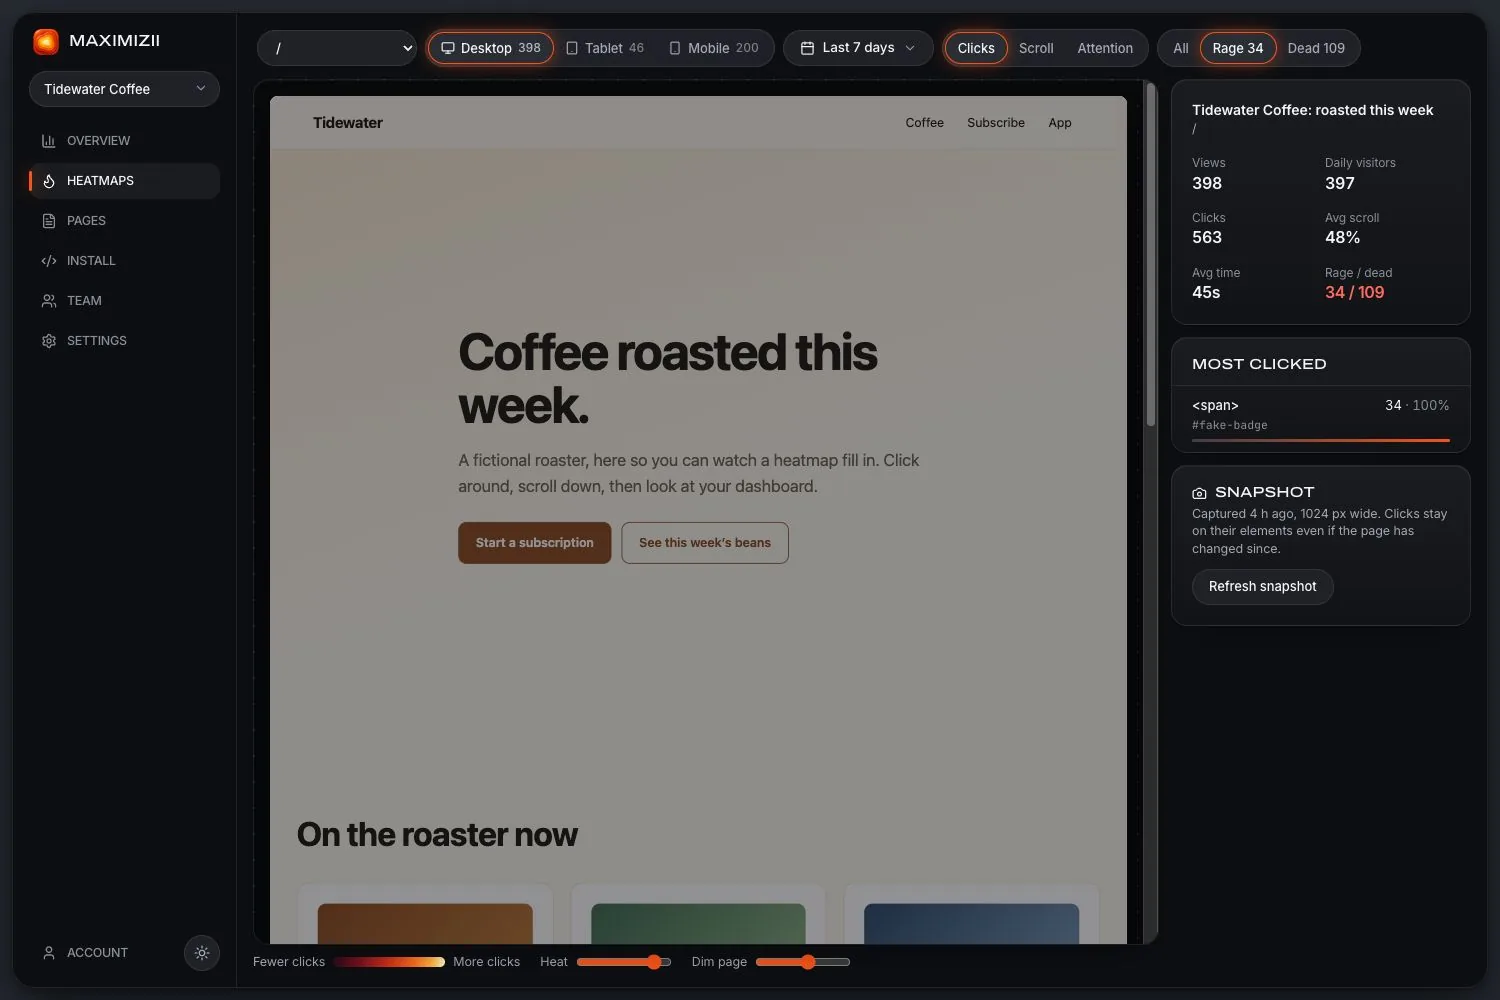
Filtered to rage clicks, the same page shows 34, and they all cluster on one element: a small badge, #fake-badge, which is a plain <span>. People clicked it repeatedly, three or more times within a second.
What to do: look at it. It looks clickable and isn’t. Make it link somewhere, or restyle it so it stops inviting clicks.
3. Dead clicks on the product cards
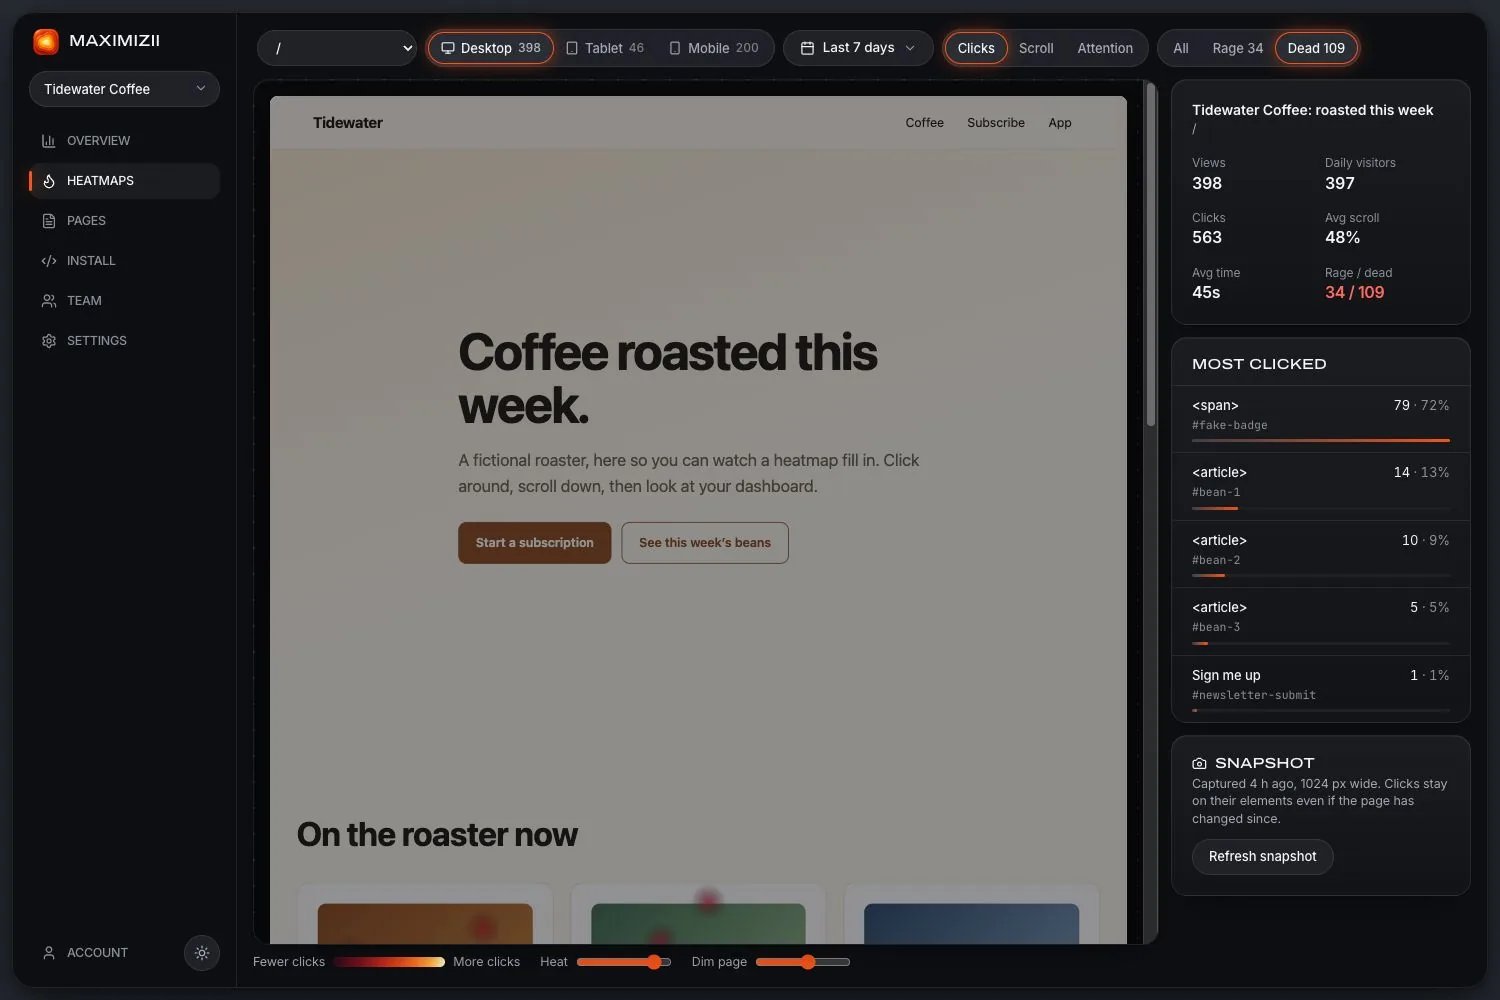
There are 109 dead clicks here. The badge accounts for 79, but the next three are the product cards: 14, 10 and 5 clicks with no response. Visitors expect a card showing a coffee to open that coffee.
What to do: make the whole card a link. This kind of dead click is often the easiest win a heatmap gives you.
4. A scroll map on a phone
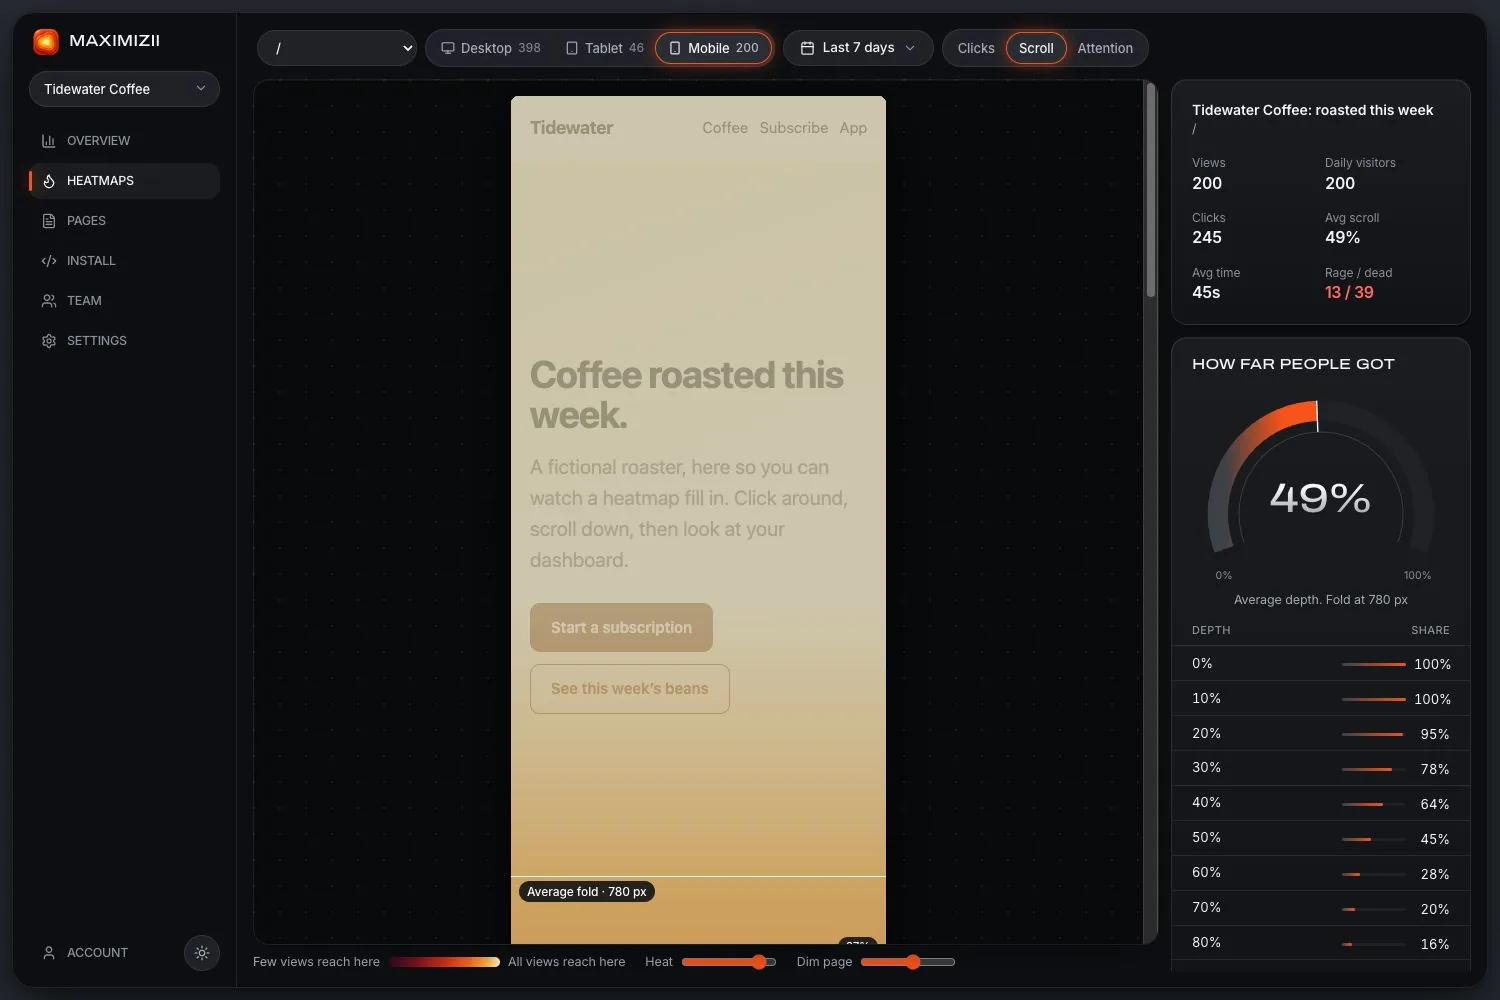
Of 200 phone views, 95% reach 20% of the way down the page, 64% reach 40%, 45% reach 50% and just 20% reach 70%. The average fold is at 780 pixels, with an average depth of 49%.
What to do: the decline is smooth, with no sudden drop, so nothing is stopping people outright. But more than half never see the page’s lower half. Anything important down there should move up.
5. An attention map
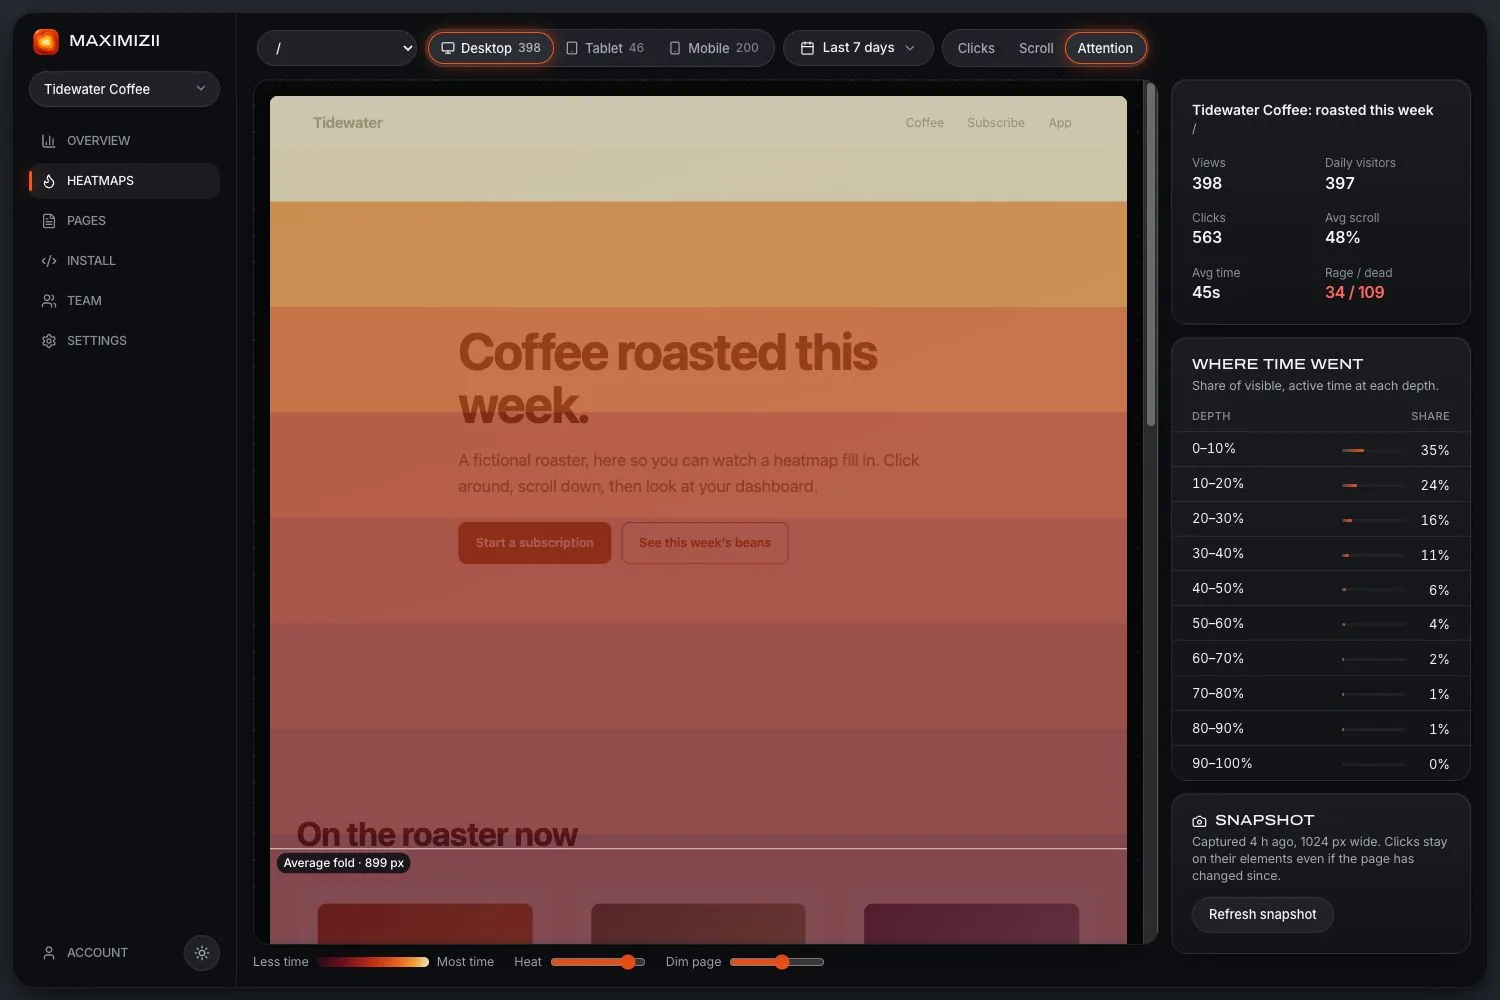
Attention shows where visible, active time went. Here, 35% went to the top tenth of the page, 24% to the next tenth, 16% to the next and 11% to the one after: 86% in the top 40%.
What to do: compare it with the scroll map. If people reach a section but spend little time there, it’s being skimmed. That’s different from not being reached, and needs a different fix.
Questions
What does a good heatmap look like?
One where the busiest spots match what you want people to do, with no heat on things that don’t respond, and a scroll map that fades gradually past your important content.
Are these real heatmaps?
They’re our real dashboard, drawing a made-up site with generated traffic. We use sample data so the examples can be shown openly, and they don’t reveal any real site’s numbers.
Why do desktop and phone maps differ so much?
The layout changes, so elements move and pages get longer, and tapping isn’t the same as clicking. Always check them separately.
Keep reading
- How to read a heatmapCheck the sample, read each map in turn, and turn what you see into a change.
- What is a heatmap?What a website heatmap shows, the main kinds, and what it can’t tell you.
- Rage clicksWhat rage clicks are, what causes them, and how to find them on your site.
- Dead clicksClicks where nothing happens: why they matter, and how they’re measured.
- Scroll mapsHow far down people get, how many reach each depth, and where the fold falls.
- Click mapsSee what people click, ranked by element, with labels and selectors.
Find out where they click.