Click maps
A click map that knows which element was clicked.
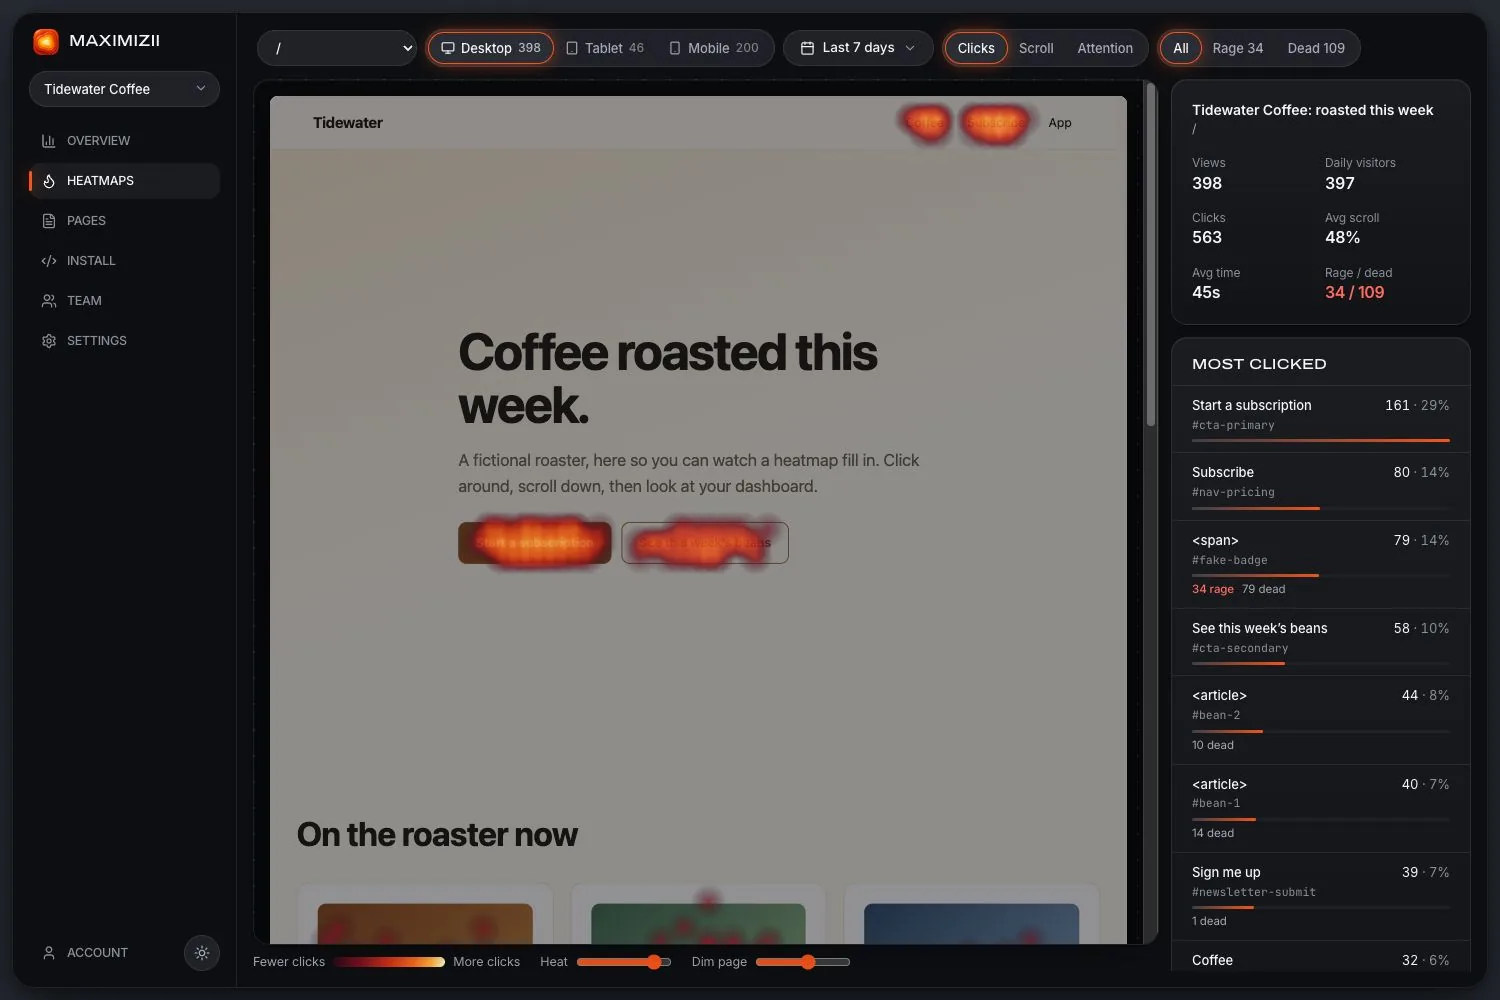
Colour shows you where. The list beside it tells you what: every element people clicked, ranked, with its label, its selector and its share of the clicks.
In short
A click map, or click heatmap, draws where people click on a page, with hot colours where there are the most clicks. Maximizii records the element as well as the position, so it stays accurate on any screen width, and it treats taps on a phone properly.
What to look for
Is your main button winning?
In the sample above, “Start a subscription” takes 29% of clicks on desktop. If your main action isn’t near the top of the list, something else has people’s attention.
Clicks on things that do nothing
A heading, an image or a badge that collects clicks is telling you people expect it to be a link. Make it one, or stop it looking like one.
Links nobody uses
A menu item with almost no clicks is a candidate for removal, and removing it gives the rest more room.
Phones against desktop
Switch devices. What’s obvious with a mouse can be out of reach, or out of sight, on a phone.
Built so the map stays accurate
A pixel position only means something at one screen width. So every click also records which element it landed on, and where on that element. Each map is drawn from those, which keeps the heat on your button when the page reflows.
On phones, a touch only counts as a tap if it’s really a tap: not the start of a scroll, not a pinch, not half of a double tap to zoom. Nothing is recorded from form fields’ values, and you can leave an element out with data-mz-ignore.
Questions
What is a click map?
A picture of a web page with colour added where people clicked, from cool for few clicks to hot for many. It adds up everyone’s clicks over a date range, so no individual is shown.
What’s the difference between a click map and a heatmap?
A heatmap is the general idea of showing data as colour on a page. A click map is the kind that shows clicks. Scroll maps and attention maps are the other common kinds.
Does it count taps on phones?
Yes, on its own device view. A touch that turns into a scroll or a pinch isn’t counted as a tap.
Can I see clicks on just one button?
Yes. Hover over an element on the map, or find it in the Most clicked list, to see its clicks, its share and any rage or dead clicks on it.
Keep reading
- Scroll mapsHow far down people get, how many reach each depth, and where the fold falls.
- Click trackingTrack every click on your site without tagging a single button.
- Rage clicksWhat rage clicks are, what causes them, and how to find them on your site.
- Dead clicksClicks where nothing happens: why they matter, and how they’re measured.
- Heatmap examplesFive real heatmaps from a sample shop, and what each one is saying.
- How to read a heatmapCheck the sample, read each map in turn, and turn what you see into a change.
Find out where they click.