Website heatmaps
Website heatmaps, from one line of code.
Paste a script tag. Within seconds of your next visit, Maximizii starts drawing where people click and how far they scroll, on a picture of the page they actually saw.
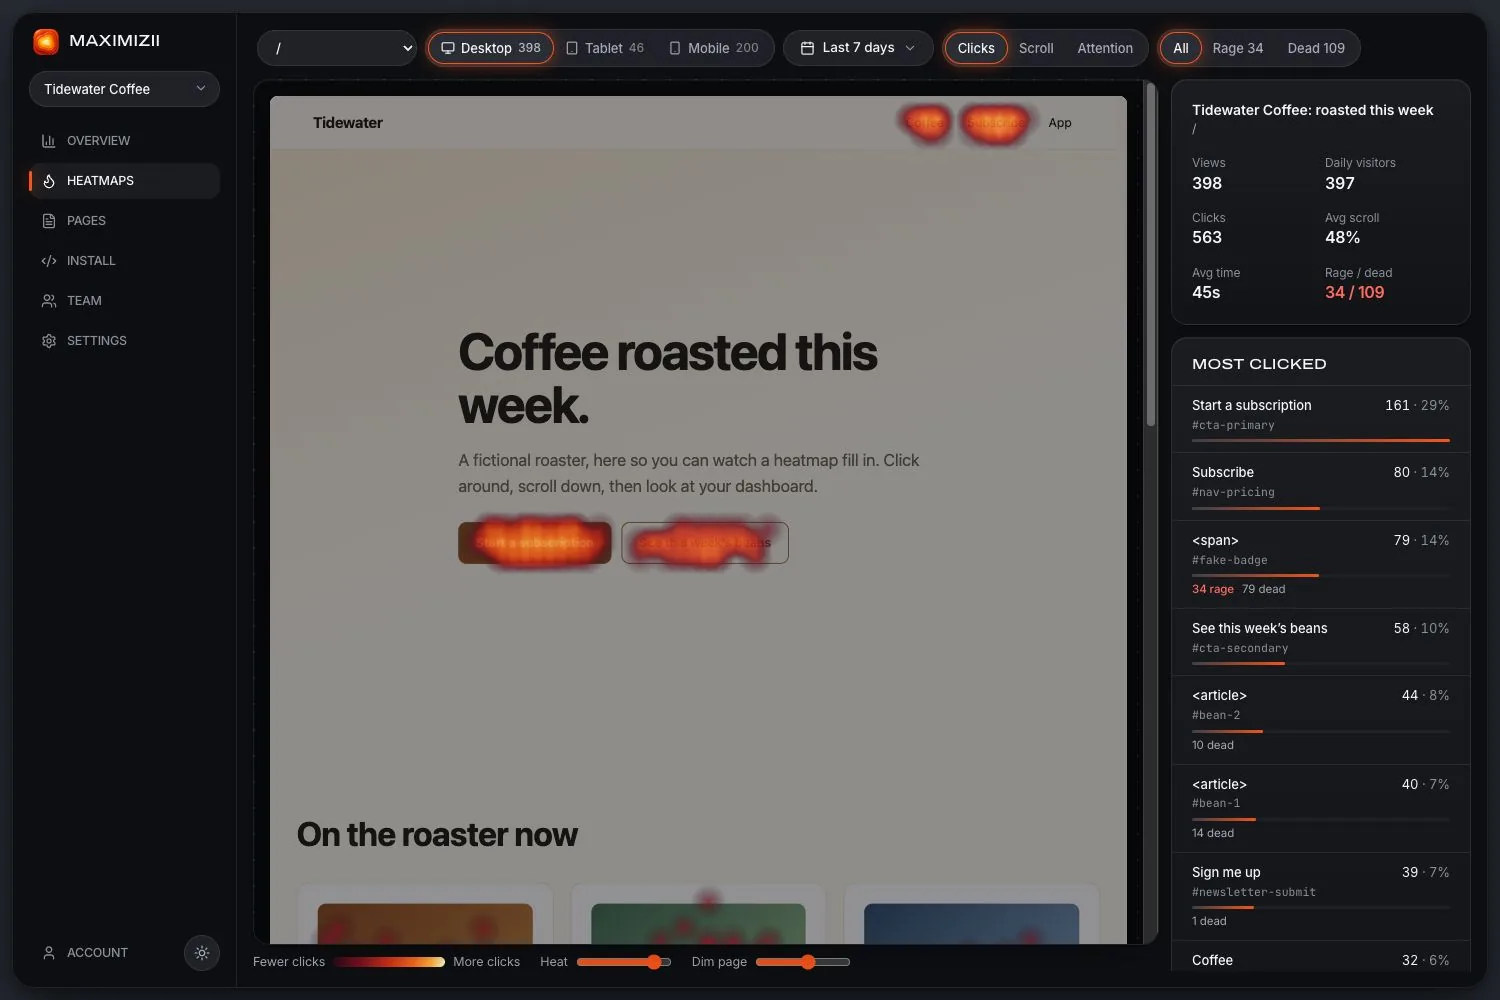
In short
A website heatmap shows what everyone did on a page, as colour on top of that page, which makes it the quickest kind of website analytics to read. Maximizii draws three of them (clicks, scroll and attention) for desktop, tablet and phone, from a script under 6 KB that sets no cookies. There’s no session replay.
- Maps
- Clicks and taps, scroll, attention
- Split by
- Page, device and date range
- Also finds
- Rage clicks and dead clicks
- Install
- Script tag, Tag Manager, Next.js or a webview
Three maps, one page
Click map
Where people click and tap, with a ranked list of the elements they chose: the label, the selector and the share of all clicks.
Scroll map
How far down people got, how many got to each depth, and where the fold falls on average for that device.
Attention map
Where the time went. Each second a page is visible and in use is added to the bands on screen.
Set it up in three steps
Add your domain
Create an account and type your domain. Subdomains count as the same site.
Paste the snippet
One line in your page’s
<head>, or a Custom HTML tag in Google Tag Manager.Open your site
The dashboard turns green by itself as soon as a real visit reaches us, and the first visit to a page sends a picture of it.
<script async src="https://d3hkloc4hxgq2b.cloudfront.net/t.js" data-site="mz_yoursiteid"></script>Clicks stay on the right element
Most pages reflow: the same button sits somewhere else on every screen width. So alongside the position on the page, Maximizii records which element was clicked and where on that element. A click on your sign-up button stays on your sign-up button, on any width, and even if the page has moved around since the picture was taken.
It’s also built for modern sites. Route changes in single-page apps count as new pages, pages that scroll inside a container are handled, and pictures wait for the page to finish loading rather than catching a spinner.
What it leaves out
There’s no session replay, no surveys, no funnels and no A/B testing. You can’t filter a map by referrer, country or campaign yet, and only the latest picture of each page is kept. If you need those, a bigger tool will suit you better: our comparisons say which.
Questions
How do I add a heatmap to my website?
Create an account, add your domain and paste the one-line snippet into your page’s head. You can also add it with Google Tag Manager or, in Next.js, with the Script component. Nothing else needs setting up.
Will a heatmap slow my website down?
Maximizii’s script is under 6 KB gzipped and loads async, so it doesn’t hold up your page. The code that takes a picture of the page is separate and loads only when a page needs one.
Does it work with single-page apps?
Yes. Route changes are picked up by themselves, including hash routes, and each path gets its own map.
How many visits do I need?
A map starts drawing from the first visit, but patterns take more. As a rough guide, wait for a few hundred views of a page on the device you’re looking at before acting on what you see.
Is it free?
There’s no paid plan yet, so it costs nothing today. Each account gets 10 sites, 2 million events a month per site, 2,000 pages per site and 90 days of data.
Keep reading
- Click mapsSee what people click, ranked by element, with labels and selectors.
- Scroll mapsHow far down people get, how many reach each depth, and where the fold falls.
- Heatmap toolWhat to look for in a heatmap tool, and where Maximizii fits and doesn’t.
- What is a heatmap?What a website heatmap shows, the main kinds, and what it can’t tell you.
- Free heatmap toolNo paid plan yet: what you get today, what the limits are, and the other free options.
- Hotjar alternativeNew Hotjar accounts now go to Contentsquare. A smaller option, if you only need maps.
Find out where they click.