Scroll maps
A scroll map shows how far down people really get.
A scroll map fades from bright, where everyone has been, to dark, where almost no one goes. If your best content sits in the dark, you’ve found your next job.
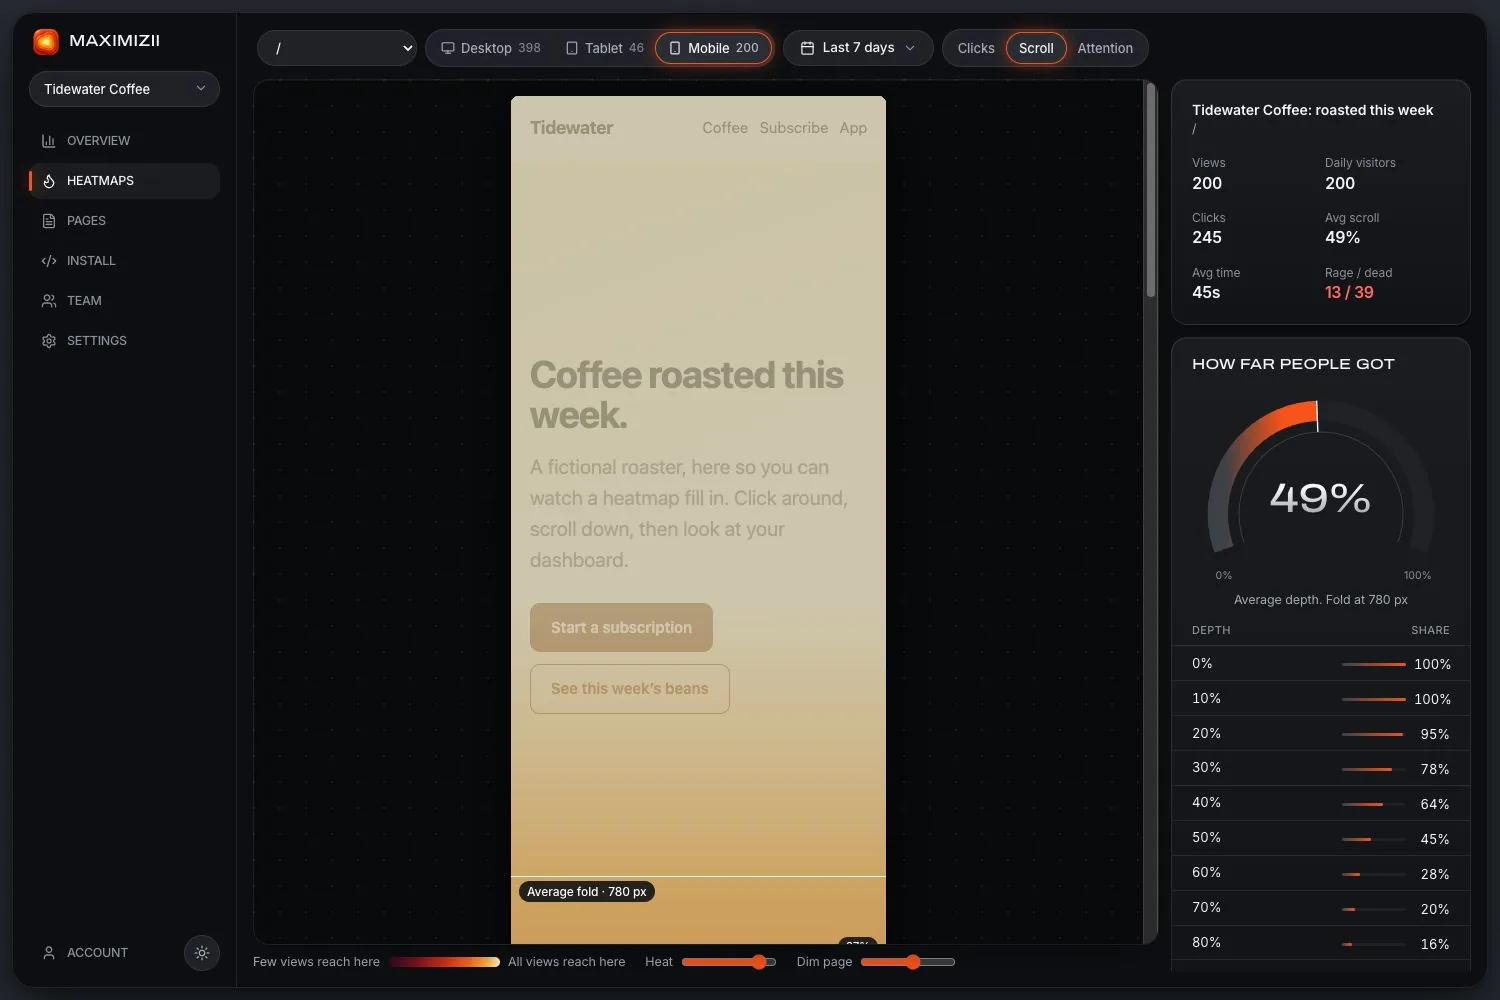
In short
A scroll map, or scroll heatmap, shows what share of visitors reached each depth of a page. Maximizii measures this per device, marks the average fold, and gives you a table of exact percentages, so you can see where people stop.
- Measured
- The share of views reaching each depth
- Fold
- The average for each page and device
- Works with
- Pages that scroll inside a container
- Split by
- Page, device and date range
Reading one
The picture above is a sample phone page. Everyone sees the first tenth, and 95% reach 20% of the way down. Then it falls away: 64% reach 40%, 45% reach 50%, and only 20% get to 70%. The average fold is 780 pixels, so anything below that needs a scroll before anyone sees it.
- A smooth fade is normal. Fewer people reach each depth, and that’s fine.
- A sharp drop at one point often means something stopped them: a section that looks like the end of the page, or a block that’s slow to read.
- A key button in the dark means most people never see it. Move it up, or repeat it.
Scroll depth, per device
A phone’s fold and a desktop’s fold are hundreds of pixels apart, and a page is often twice as long on a phone. So each device gets its own map, its own fold line and its own table. It also copes with apps and sites that scroll inside a container rather than the page itself, which plain scroll tracking tends to miss.
And where the time goes
Reaching a section doesn’t mean reading it. The attention map shows where visible, active time went, band by band. A section people reach but pass straight through looks very different from one they stop at. See how to read them together.
Questions
What is a scroll map?
A picture of a page, coloured by how many visitors reached each depth. The top is usually brightest, because everyone sees it, and the colour fades as fewer people get further down.
What is a good scroll depth?
There’s no single number. It depends on the page’s length and its job. Compare a page against itself over time, and check that people reach the part that matters, rather than aiming for a target.
How is scroll depth measured?
Maximizii records the deepest point each page view reached, as a share of the page’s height, and adds those up by depth. Each device is kept separate.
What’s the fold?
The bottom of the screen before any scrolling. It differs by device, so Maximizii marks the average for each page and device. Read more about above the fold.
Keep reading
- Click mapsSee what people click, ranked by element, with labels and selectors.
- Above the foldWhat it means, why there’s no single fold, and how to find yours.
- How to read a heatmapCheck the sample, read each map in turn, and turn what you see into a change.
- Google Analytics heatmapsGA4 doesn’t draw heatmaps. What it does record, and how to add one alongside it.
- Landing page heatmapsIs your main button seen and clicked? Check before you spend more on traffic.
- Heatmap examplesFive real heatmaps from a sample shop, and what each one is saying.
Find out where they click.