Guide
Google Analytics heatmaps: does GA4 have them?
Not in the sense most people mean. Google Analytics 4 can tell you how many people scrolled or clicked a link out, but it doesn’t draw that over your page.
In short
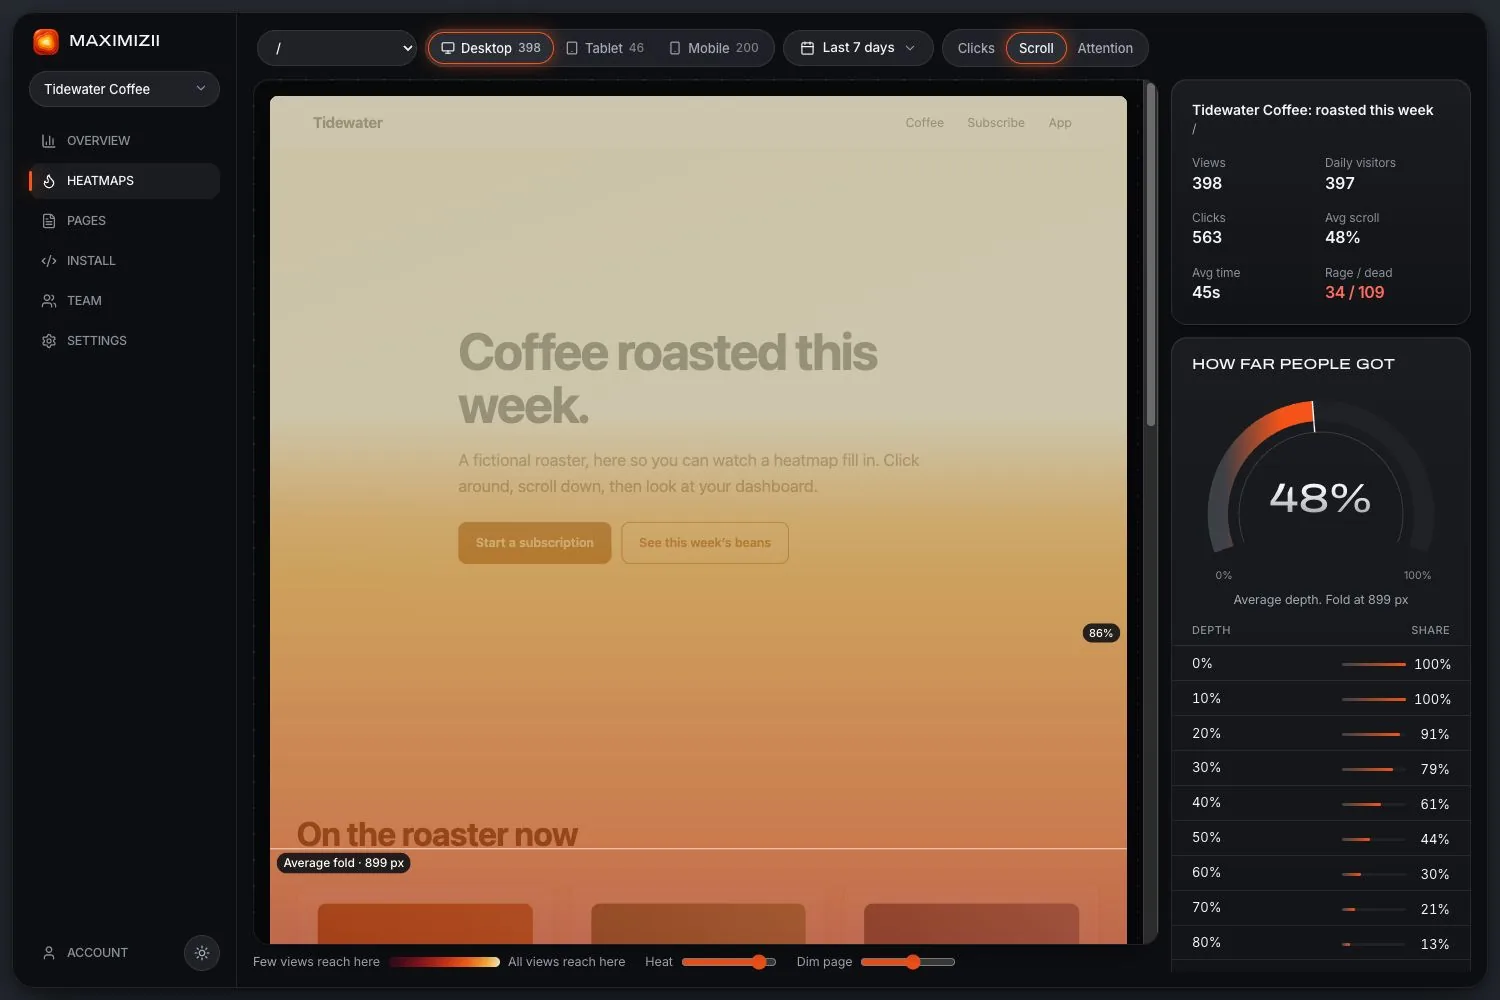
Google Analytics 4 doesn’t draw click or scroll heatmaps. Its enhanced measurement sends a scroll event at 90% depth, and click events for links leaving your site. To see where on a page people click and how far they get, you need a heatmap tool beside it.
What GA4 records by default
You can add more detail to GA4 with custom events, such as extra scroll depths or tagged buttons, in Google Tag Manager. That’s useful for numbers you’ll report on, but it’s work per event, and it won’t draw anything on your page. See Google’s enhanced measurement documentation, checked in November 2026.
They work well together
Keep Google Analytics for the questions it’s good at: traffic, sources and conversions over time. Use a heatmap to look at a single page: why isn’t this converting, and what are people doing on it? They don’t interfere with each other, and Maximizii’s script doesn’t depend on any other tag.
Adding one with Google Tag Manager
Create an account and add your site
You’ll get a snippet with your site’s id.
Add a Custom HTML tag
In Tag Manager, paste the snippet in, and set it to fire on All Pages.
Publish
Open your site. The dashboard turns green by itself when the first visit arrives.
Questions
Does GA4 have a heatmap?
No. It has reports, and an explorations area with a “heat map” style of table, but that colours cells in a table. It doesn’t draw clicks or scrolling on your page.
How do I see scroll depth in Google Analytics?
Enhanced measurement sends a scroll event once 90% of a page’s depth is visible. For other depths, you’d add custom events in Tag Manager. A scroll map shows every depth without that setup.
Can I get a heatmap for free alongside GA4?
Yes. Maximizii has no paid plan yet, and Microsoft Clarity is free.
Keep reading
- Scroll mapsHow far down people get, how many reach each depth, and where the fold falls.
- Click trackingTrack every click on your site without tagging a single button.
- Website heatmapsClick, scroll and attention maps over a picture of your real page, from one line of code.
- Microsoft Clarity alternativeClarity is free with replay. Here’s when no cookies and no recordings matter more.
- How to read a heatmapCheck the sample, read each map in turn, and turn what you see into a change.
- User behavior analyticsWhat it means for a website, the main kinds of tool, and which you need.
Find out where they click.